
The overwhelming consensus was that Brexit – which raised trade barriers with the EU – would make the UK less open, less competitive and reduce the size of the economy. The fact that the UK is the only G7 country yet to regain its pandemic level of GDP seemed to corroborate these gloomy predictions. But recent trade data seems to challenge that story: after experiencing the biggest deterioration in openness in the G7 in 2021, the UK saw a partial recovery in 2022. This left the UK relatively more open, outperforming France and the US, with trade-relative-to-GDP rising by 7 per cent. This was entirely driven by stronger export performance, with imports remaining the weakest in the G7.
So, what is going on? For goods exports the story is simple: two-fifths of the whopping 17 per cent rise in UK goods exports was accounted for by exports of precious metals to just four countries looking to rebalance their foreign exchange reserves. These exports do little for the UK’s economic prospects and once they are excluded, UK goods exports remain 5.7 per cent below pre-Trade and Cooperation Agreement (TCA) levels. For services, the situation is more nuanced. Our services exports have benefited enormously from the global pandemic recovery with demand growing in sectors where we have an established comparative advantage including insurance, financial services, other business services and personal, cultural and recreational services. The UK is leveraging this tailwind, outperforming other OECD countries, with services exports 3.6 per cent higher than a typical OECD country post-TCA even after accounting for the UK’s sectoral makeup. However, this rise could be inflated by nearly £12 billion of adjustments made by the ONS to UK services trade in 2022 – without this the UK’s recent record of services exports would look much more ordinary, rather than being the strongest in the G7.
Overall, then, while it is encouraging that the UK has become more open, we should be cautious in assuming this indicates the UK has become more competitive in recent months despite Brexit. The drivers of goods export growth will likely be short lived. And while the UK may be able to continue to leverage our services strengths, where exports appear to be showing resilience in the face of new barriers, we cannot be complacent. Given the scale of the potential impacts, we will need to watch the trade data closely, particularly the important but often overlooked services trade data, in order to understand what is happening and how UK firms are faring post-Brexit.
On the face of it, UK trade performance has been better-than-feared two years into the new trading arrangement with the EU
The consensus was that leaving the EU would make the UK less open to trade as the TCA, implemented in January 2021, introduced new trade barriers with the EU. A range of modelling estimates (including in our previous work) suggest that over a 10-to-15-year period trade openness might be expected to fall by 5-20 per cent, and this would be one of the drivers of a smaller UK economy due to Brexit. As the UK economy has struggled in the wake of the pandemic and the cost of living crisis, it is the only G7 economy yet to recover to a pre-pandemic level of output. Many assumed this had been at least partly driven by a fall in UK trade openness.
But, on the face of it, recent trade data suggests the UK is not performing as badly as many feared in recent months. As shown in Figure 1, while openness fell immediately following the implementation of the TCA, it has rebounded in the second half of 2022, both in absolute and relative terms. After trade was adjusted for measurement changes to UK-EU goods trade, the UK had the weakest openness performance in the G7 over 2021, the first year outside the EU. However, by the end of 2022 UK openness was outperforming both France and the US and UK trade openness was 7 per cent higher in 2022 than in 2021.
Figure 1: UK trade openness no longer an outlier among G7 comparators

But with other things going on, not least global trade disruptions created by the Covid-19 pandemic and global inflationary pressures caused by the conflict in Ukraine, it is important to look closely at drivers of this strong trade performance.
UK trade openness has been held up by strong export performance
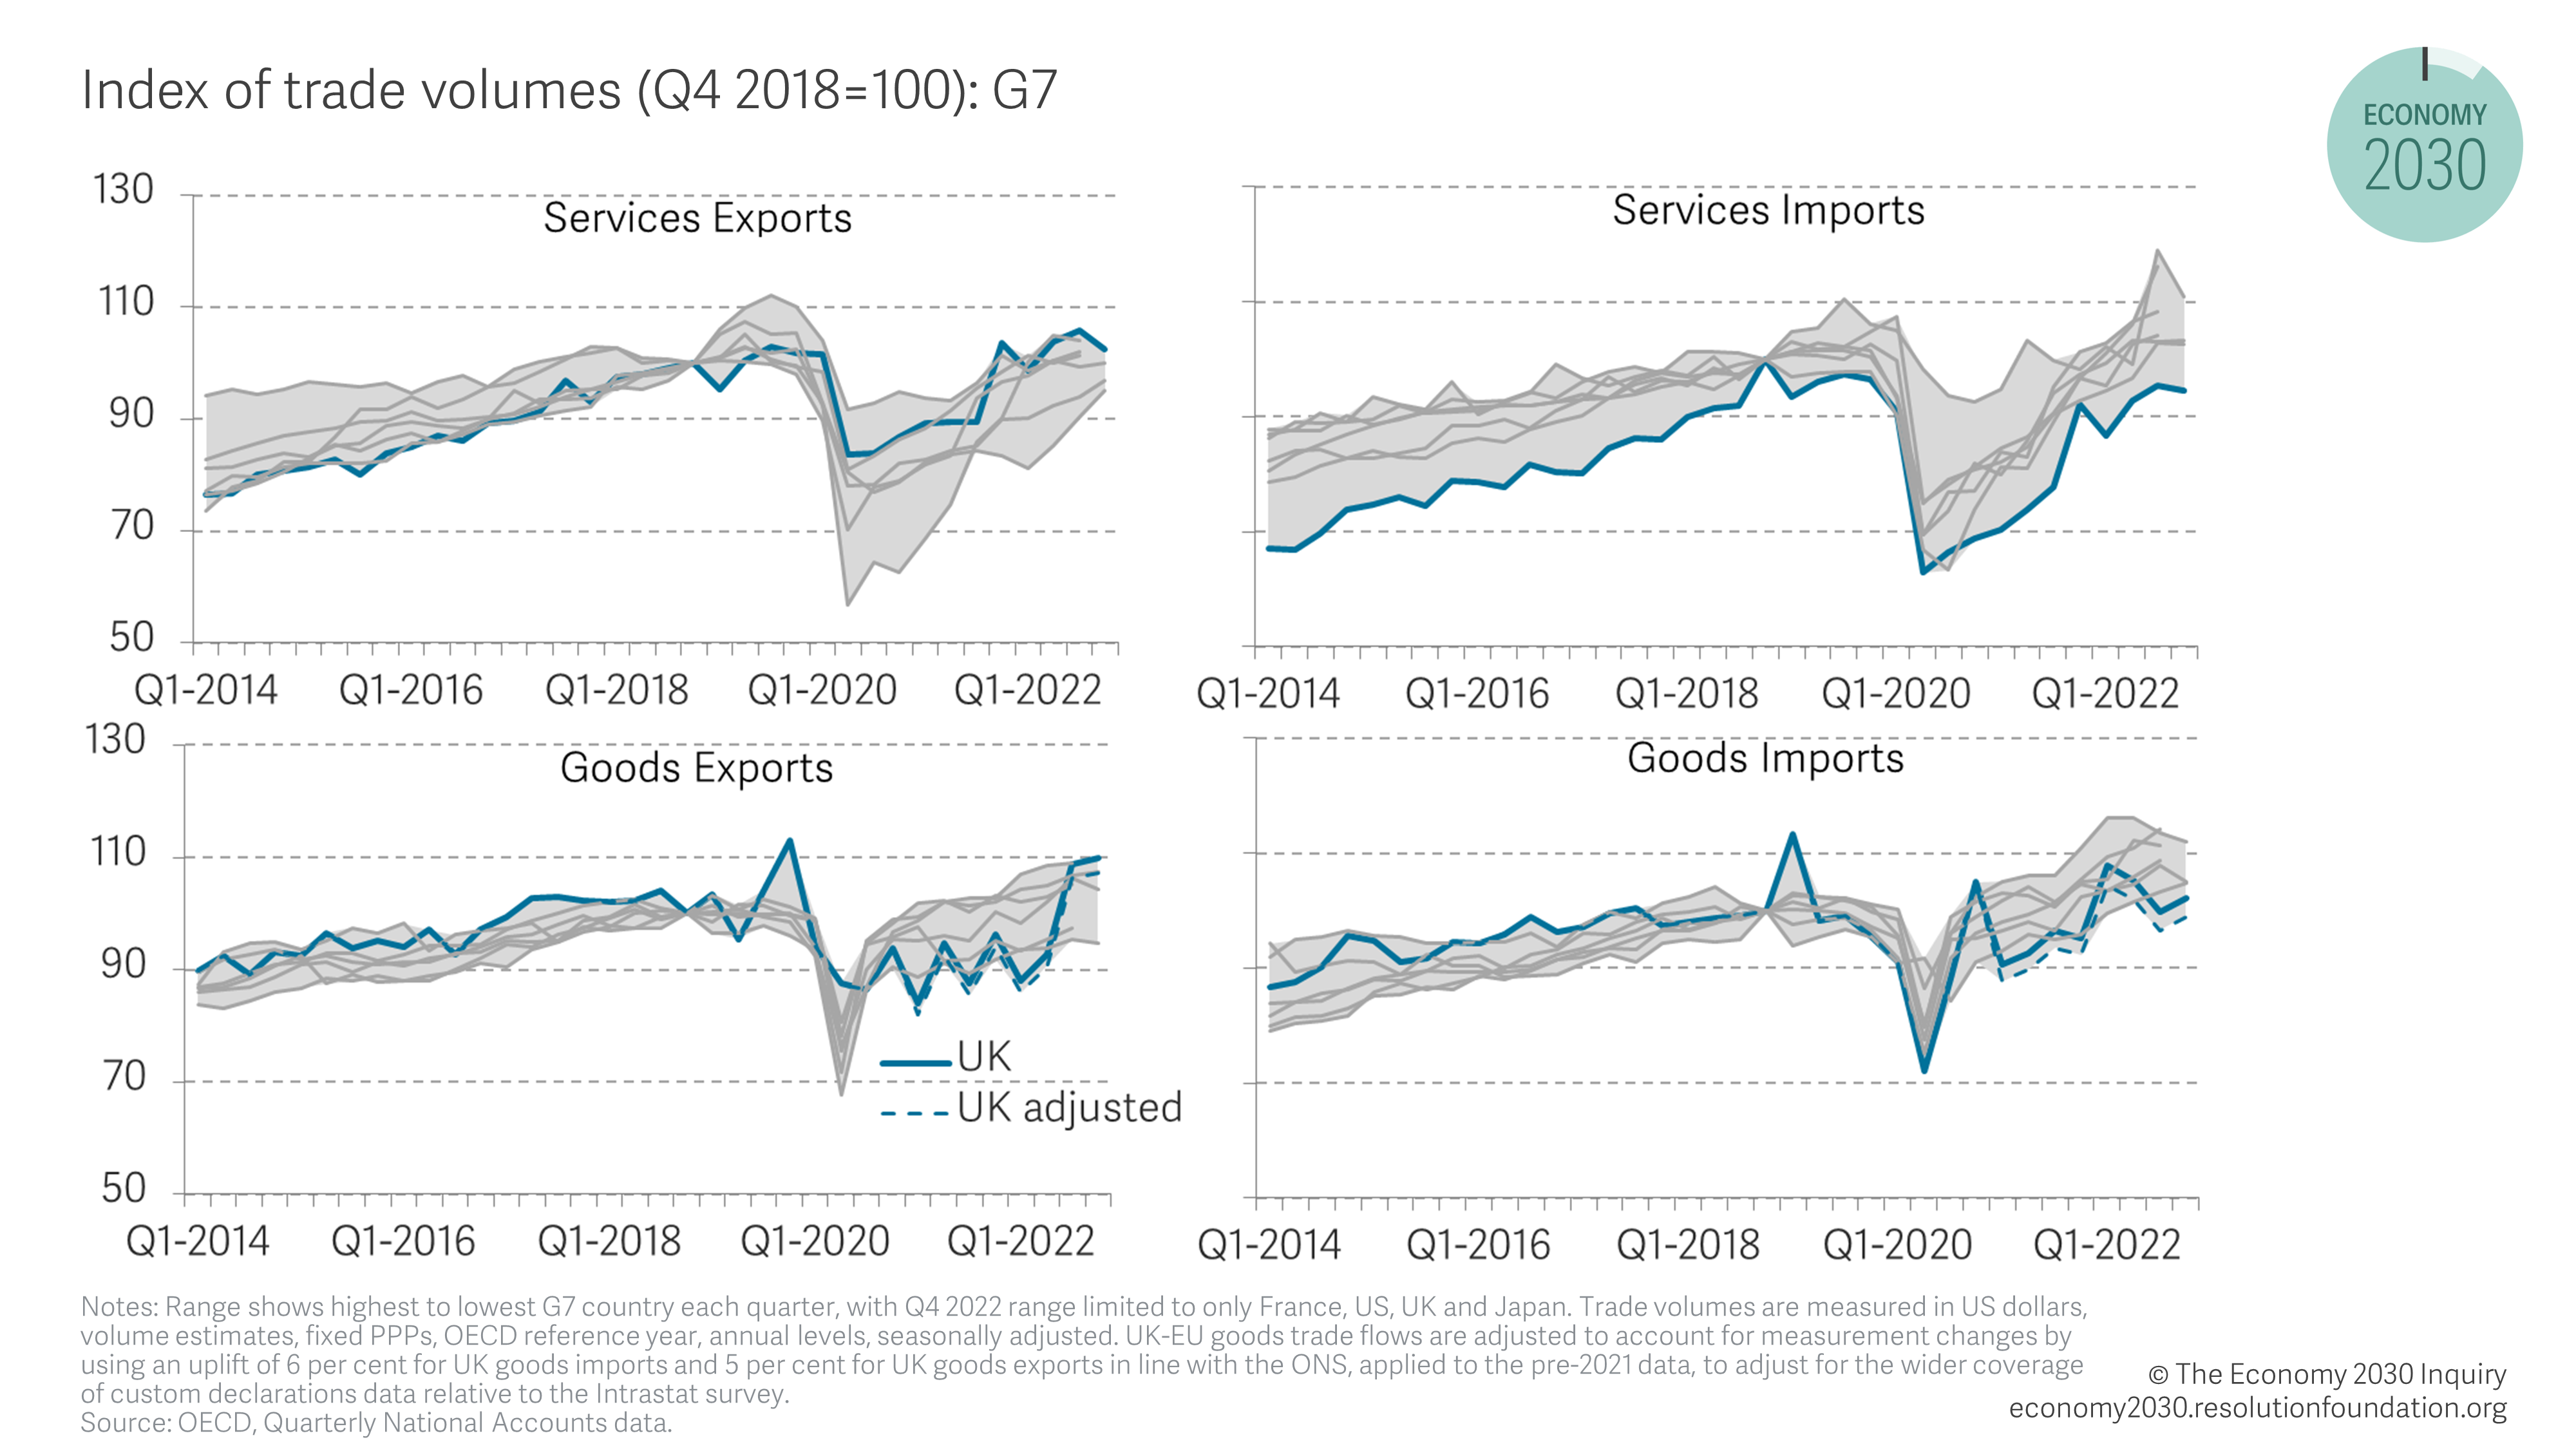
As shown in Figure 2, since the start of 2021 UK import volumes, of both goods and services, have consistently underperformed the rest of the G7. Consistent with expectations that new trade barriers would lead to a fall in imports from the EU, it is weaker goods imports from the EU driving the UK’s weaker performance – imported volumes from outside the EU have recovered to pre-pandemic levels but imported volumes from the EU remained 8 per cent below 2018 levels in 2022. The UKTPO found UK goods imports from the EU relative to imports from non-EU are down by 28 per cent.
But, since the start of last year, UK trade openness has recovered, reflecting strong export performance. Figure 2 shows the UK has experienced a sustained period of strong services export performance, with the strongest performance in the G7 over the period between Q4 2021 and Q4 2022. UK services exports were 15 per cent higher in Q1-Q3 2022 than in the same period in 2021. Goods export strength is, however, a more recent phenomenon with UK goods export volumes rising by around 17 per cent in Q3 2022. This shifted the UK’s goods export performance from the weakest performer of the G7, to among the strongest performers (even after adjusting for measurement changes that inflated post-TCA goods trade).
Figure 2: UK exports volumes have overperformed
Therefore, the key question is: what is driving the strong performance of UK exports?
UK goods exports are inflated by gold and precious metals
At first blush, volumes of UK goods exports made an astonishing recovery to pre-pandemic levels in the second half of 2022. Alas, this upturn is primarily driven by notoriously volatile precious metals exports which have little economic benefit to the UK. More than two-fifths (41.7 per cent) of UK goods export growth between H2 2021 and H2 2022 was driven by precious metals exports from the UK to just four countries (China, Hong Kong, Switzerland and the UAE).
This source of growth in goods exports is likely to be temporary. Demand for precious metals rose by at least 28 per cent in 2022, primarily driven by a flight towards safer assets amid soaring inflation.[i] Several central banks are buying gold, but particularly those nations seeking a safe asset alternative to the dollar, in particular China and Russia. The UK’s exports to Hong Kong and China saw exceptional growth of 97 per cent and 139 per cent respectively between the second half of 2021 and the second half of 2022 almost entirely driven by growth in exports of precious metals. It is unlikely that such flows will continue into the longer term, and even if they did, gold and precious metal exports have little meaningful economic benefit for the UK. Indeed, unlike most goods, gold and other precious metals are primarily used as a store of value with billions of pounds traded at high frequencies. From a macroeconomic perspective, selling gold contributes little value added to the economy and leads to a negative investment, meaning a gold export has a neutral effect on GDP.
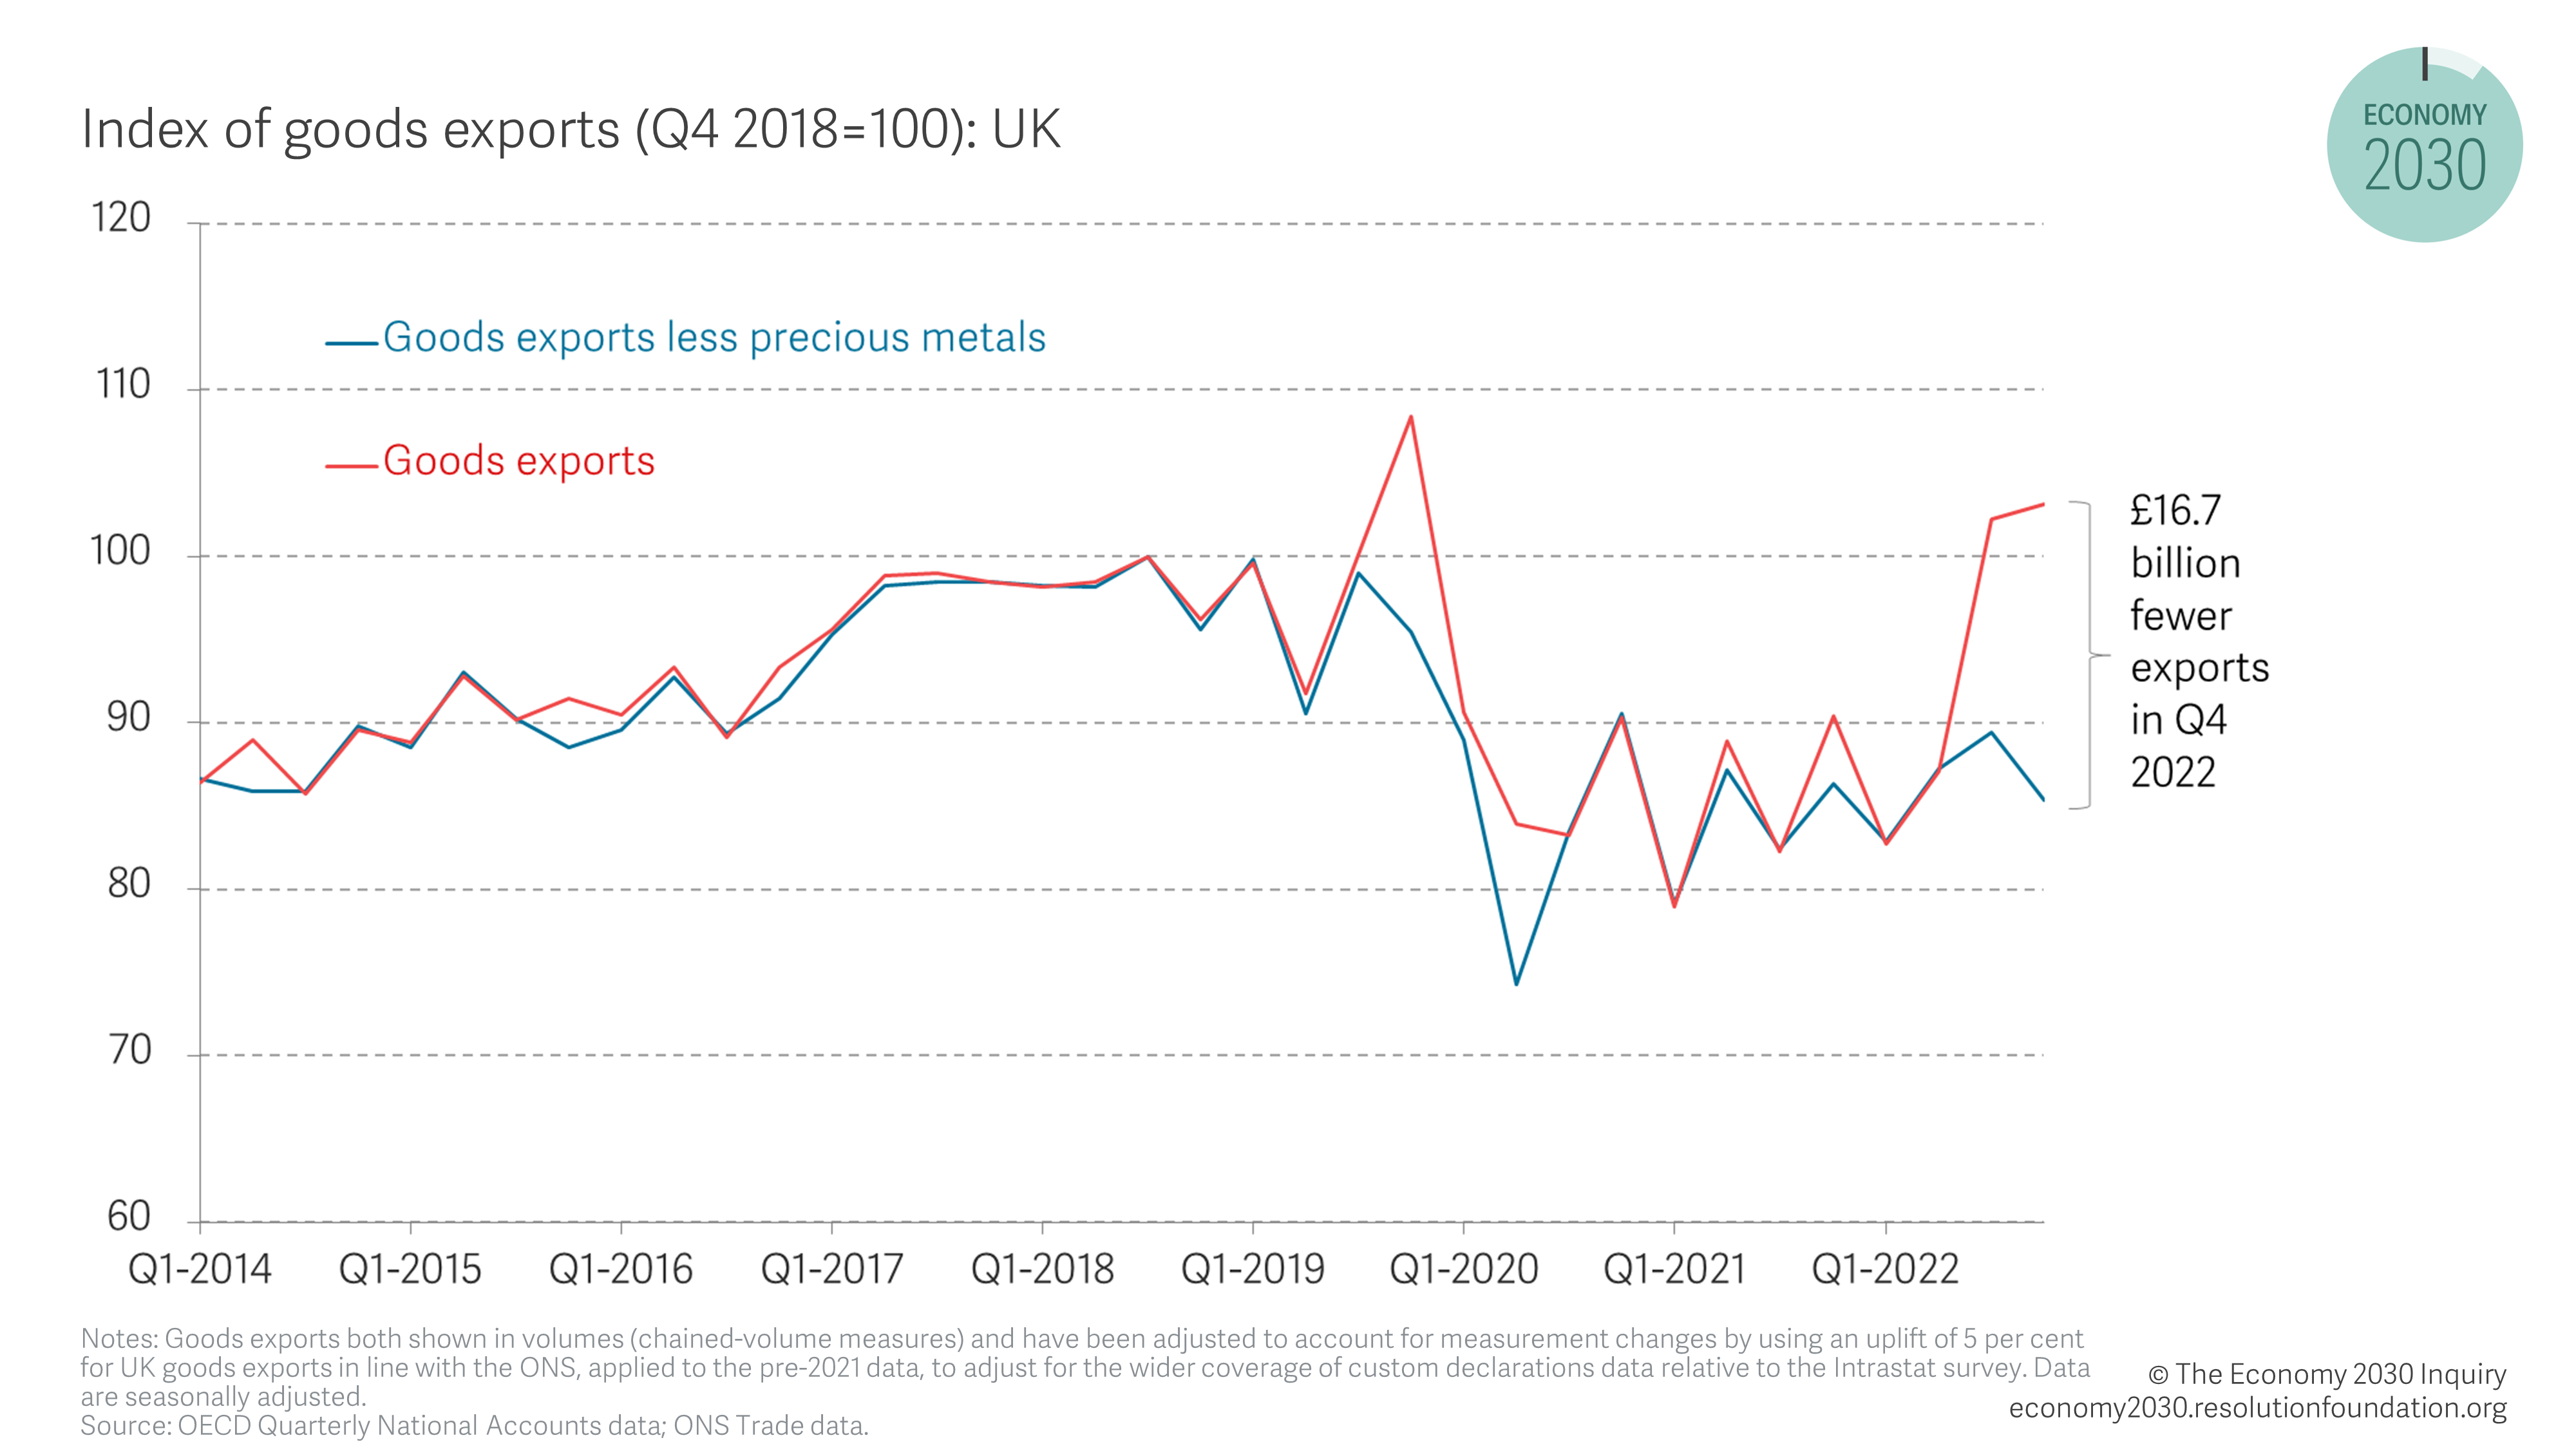
Excluding precious metals, we find that the UK goods exports remain below pre-pandemic levels, as shown in Figure 3. Including precious metals, goods exports volumes in Q4 2022 were 14.2 per cent above Q4 2020 and 7.2 per cent above Q4 2018, but excluding precious metals from goods exports in Q4 2022 are 5.7 per cent below Q4 2020 and 10.7 per cent below Q4 2018 respectively.
Figure 3: Goods exports are weak when precious metals are excluded
UK services exports are gaining market share propelled by enormously beneficial shifts in global demand and exagerated by measurement issues
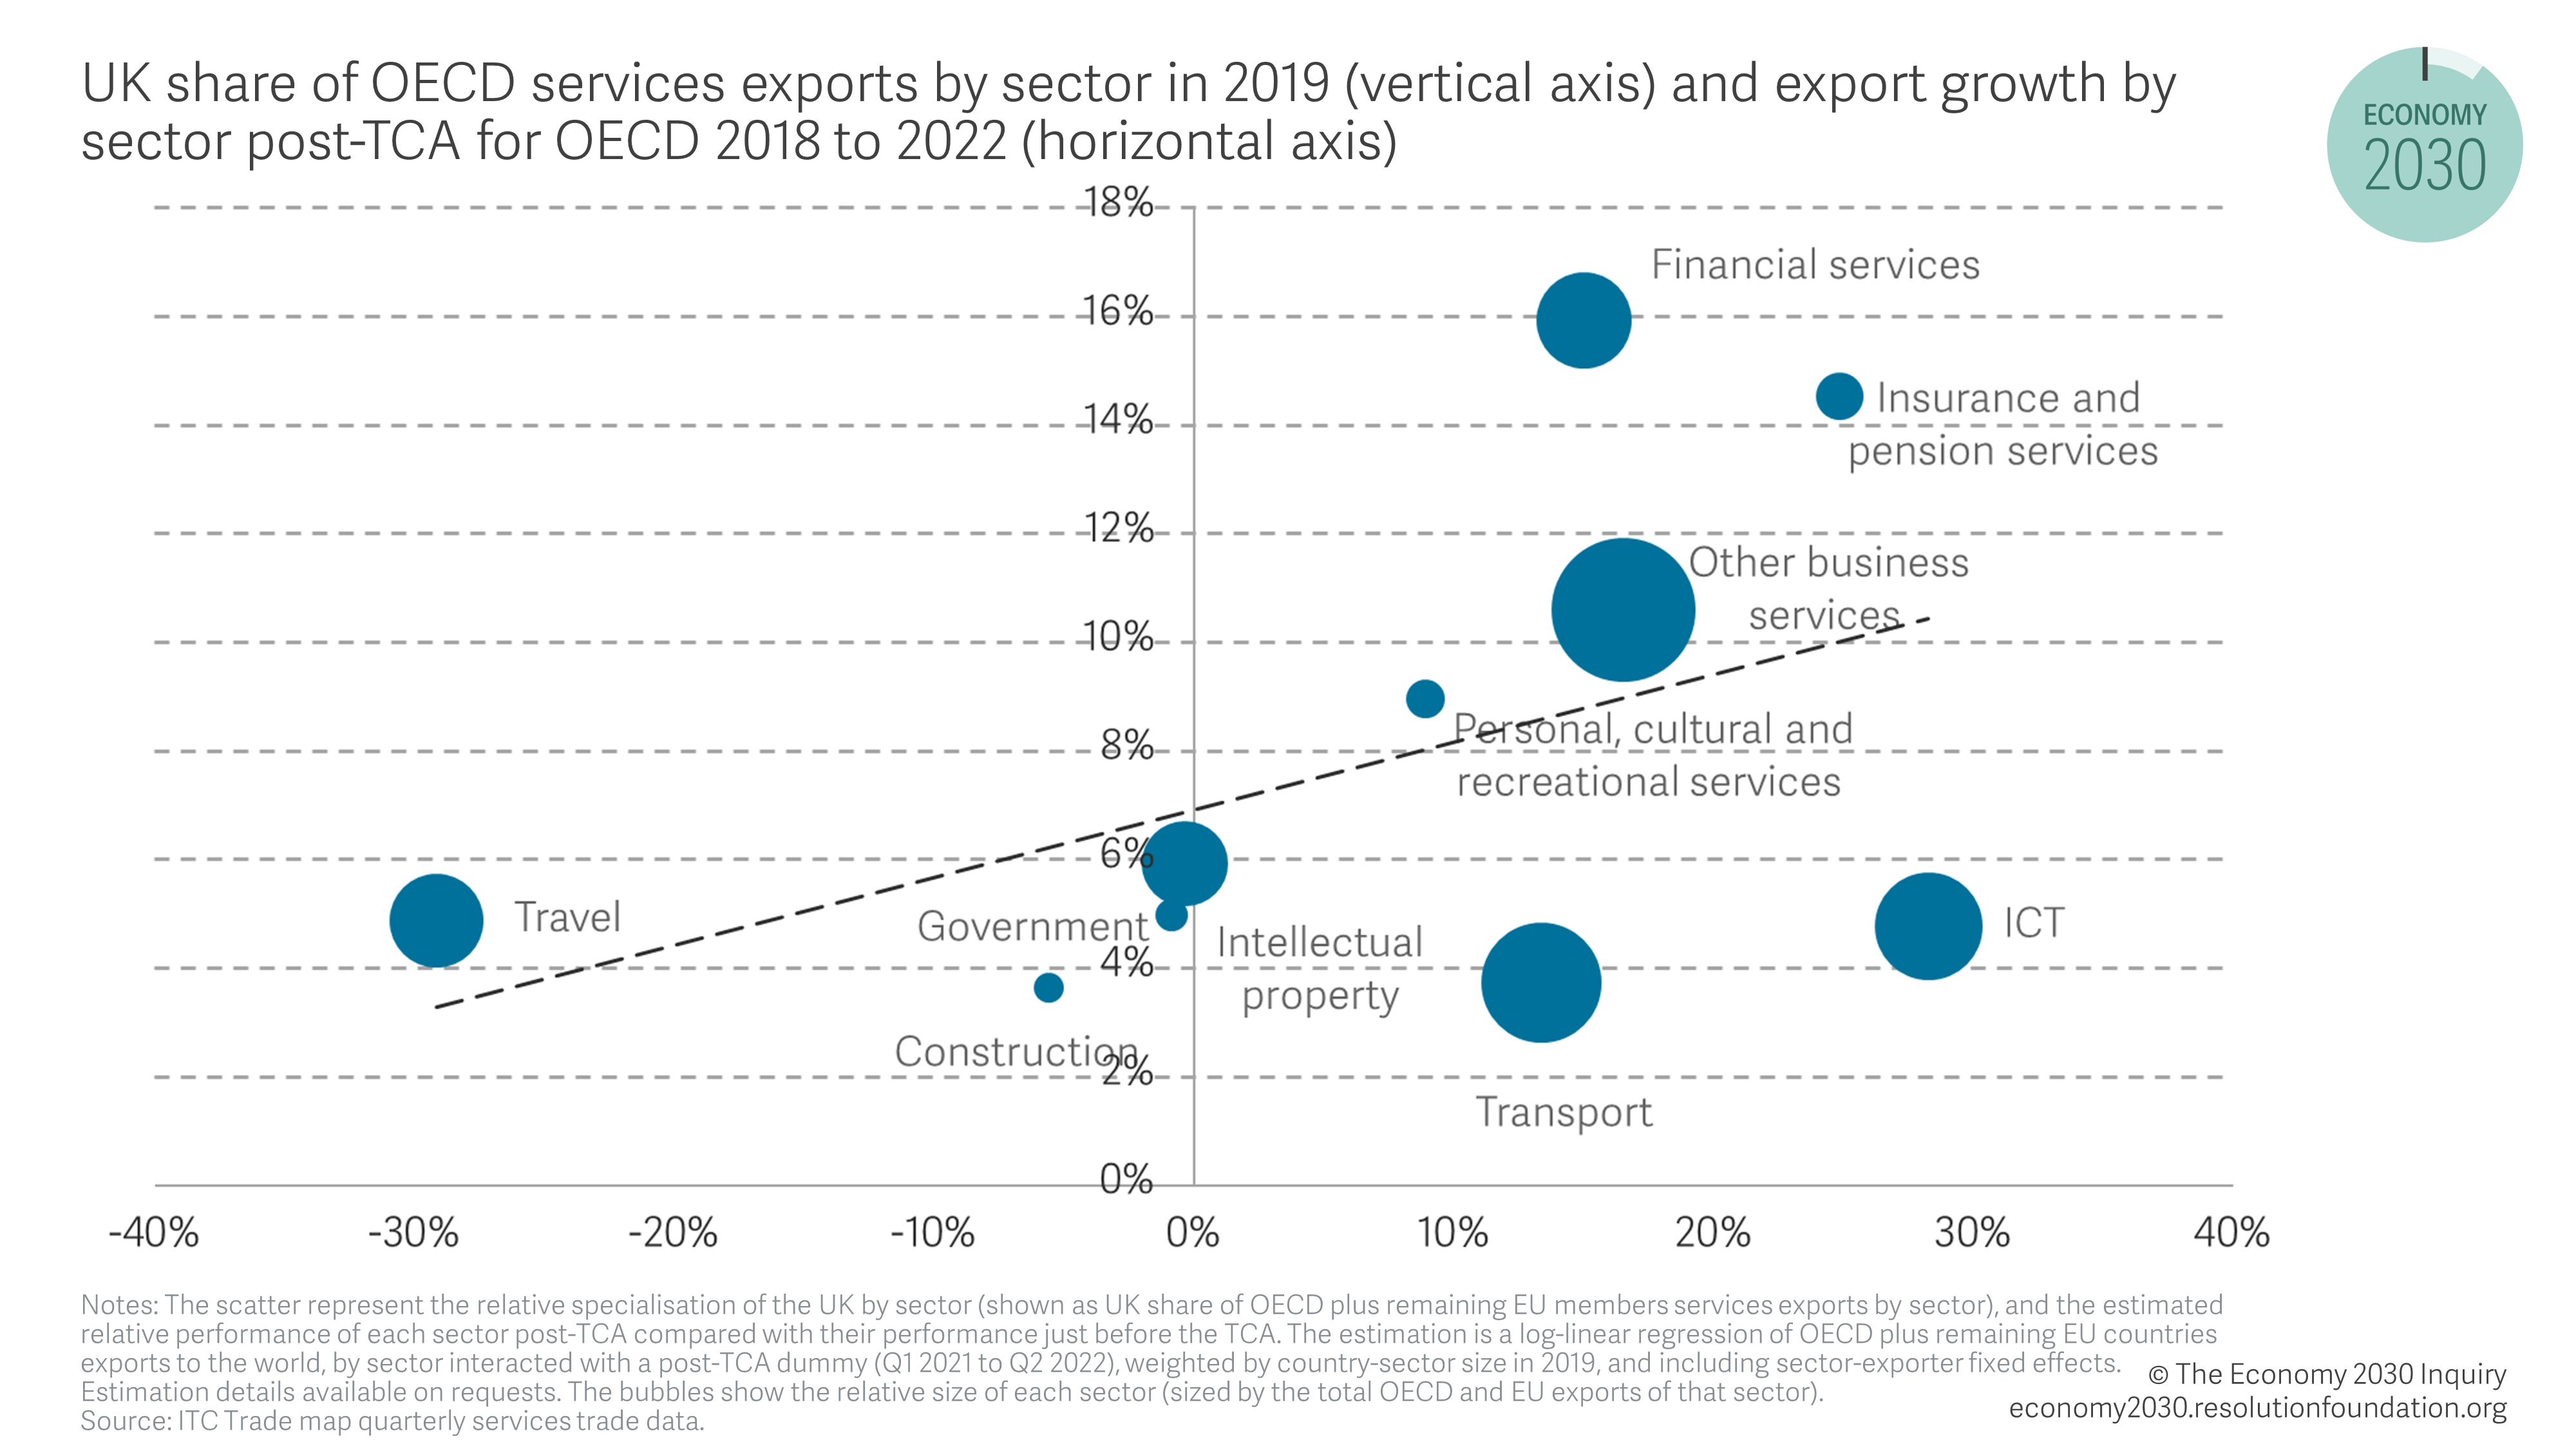
Global services demand has grown rapidly in sectors where the UK has an established comparative advantage, including: insurance, financial services, other business services, as well as personal, cultural and recreational services. This immensely beneficial global backdrop has enabled broad based growth in UK services exports in 2022 to a diverse group of countries including the US, France and Germany, China, Saudi Arabia and India, and for service exports to recover more quickly than G7 comparators. Indeed, since the TCA was implemented at the start of 2021, the sectors which have seen the strongest export performance across the OECD (plus remaining EU countries) are those in which the UK is more specialised as shown in Figure 4. For example, the UK accounts for 10.6 per cent of OECD and EU other business services and this sector outperformed total services exports in the OECD by 9.5 per cent post-TCA. The specialisation of UK exporters in growth sectors is not only good news for them but for the economy as a whole.
Figure 4: UK services exports benefited from favourable global demand
Specialising in growing services industries has the potential to be a winning strategy for the UK. What’s more, even when we control for country-sector combinations, UK services exports have overperformed a typical OECD country by 3.6 per cent since the TCA was implemented.[ii] Strong performance in two sectors in particular – other business services and travel – means that the UK has increased its market share of total services exports (0.4 percentage points) among the OECD, as shown in Figure 5. This is despite losing market share in several other sectors the UK has traditionally has strong comparative advantages in, including personal, cultural and recreational services, finance and insurance.
Figure 5: The UK gained market share in other business services and travel exports
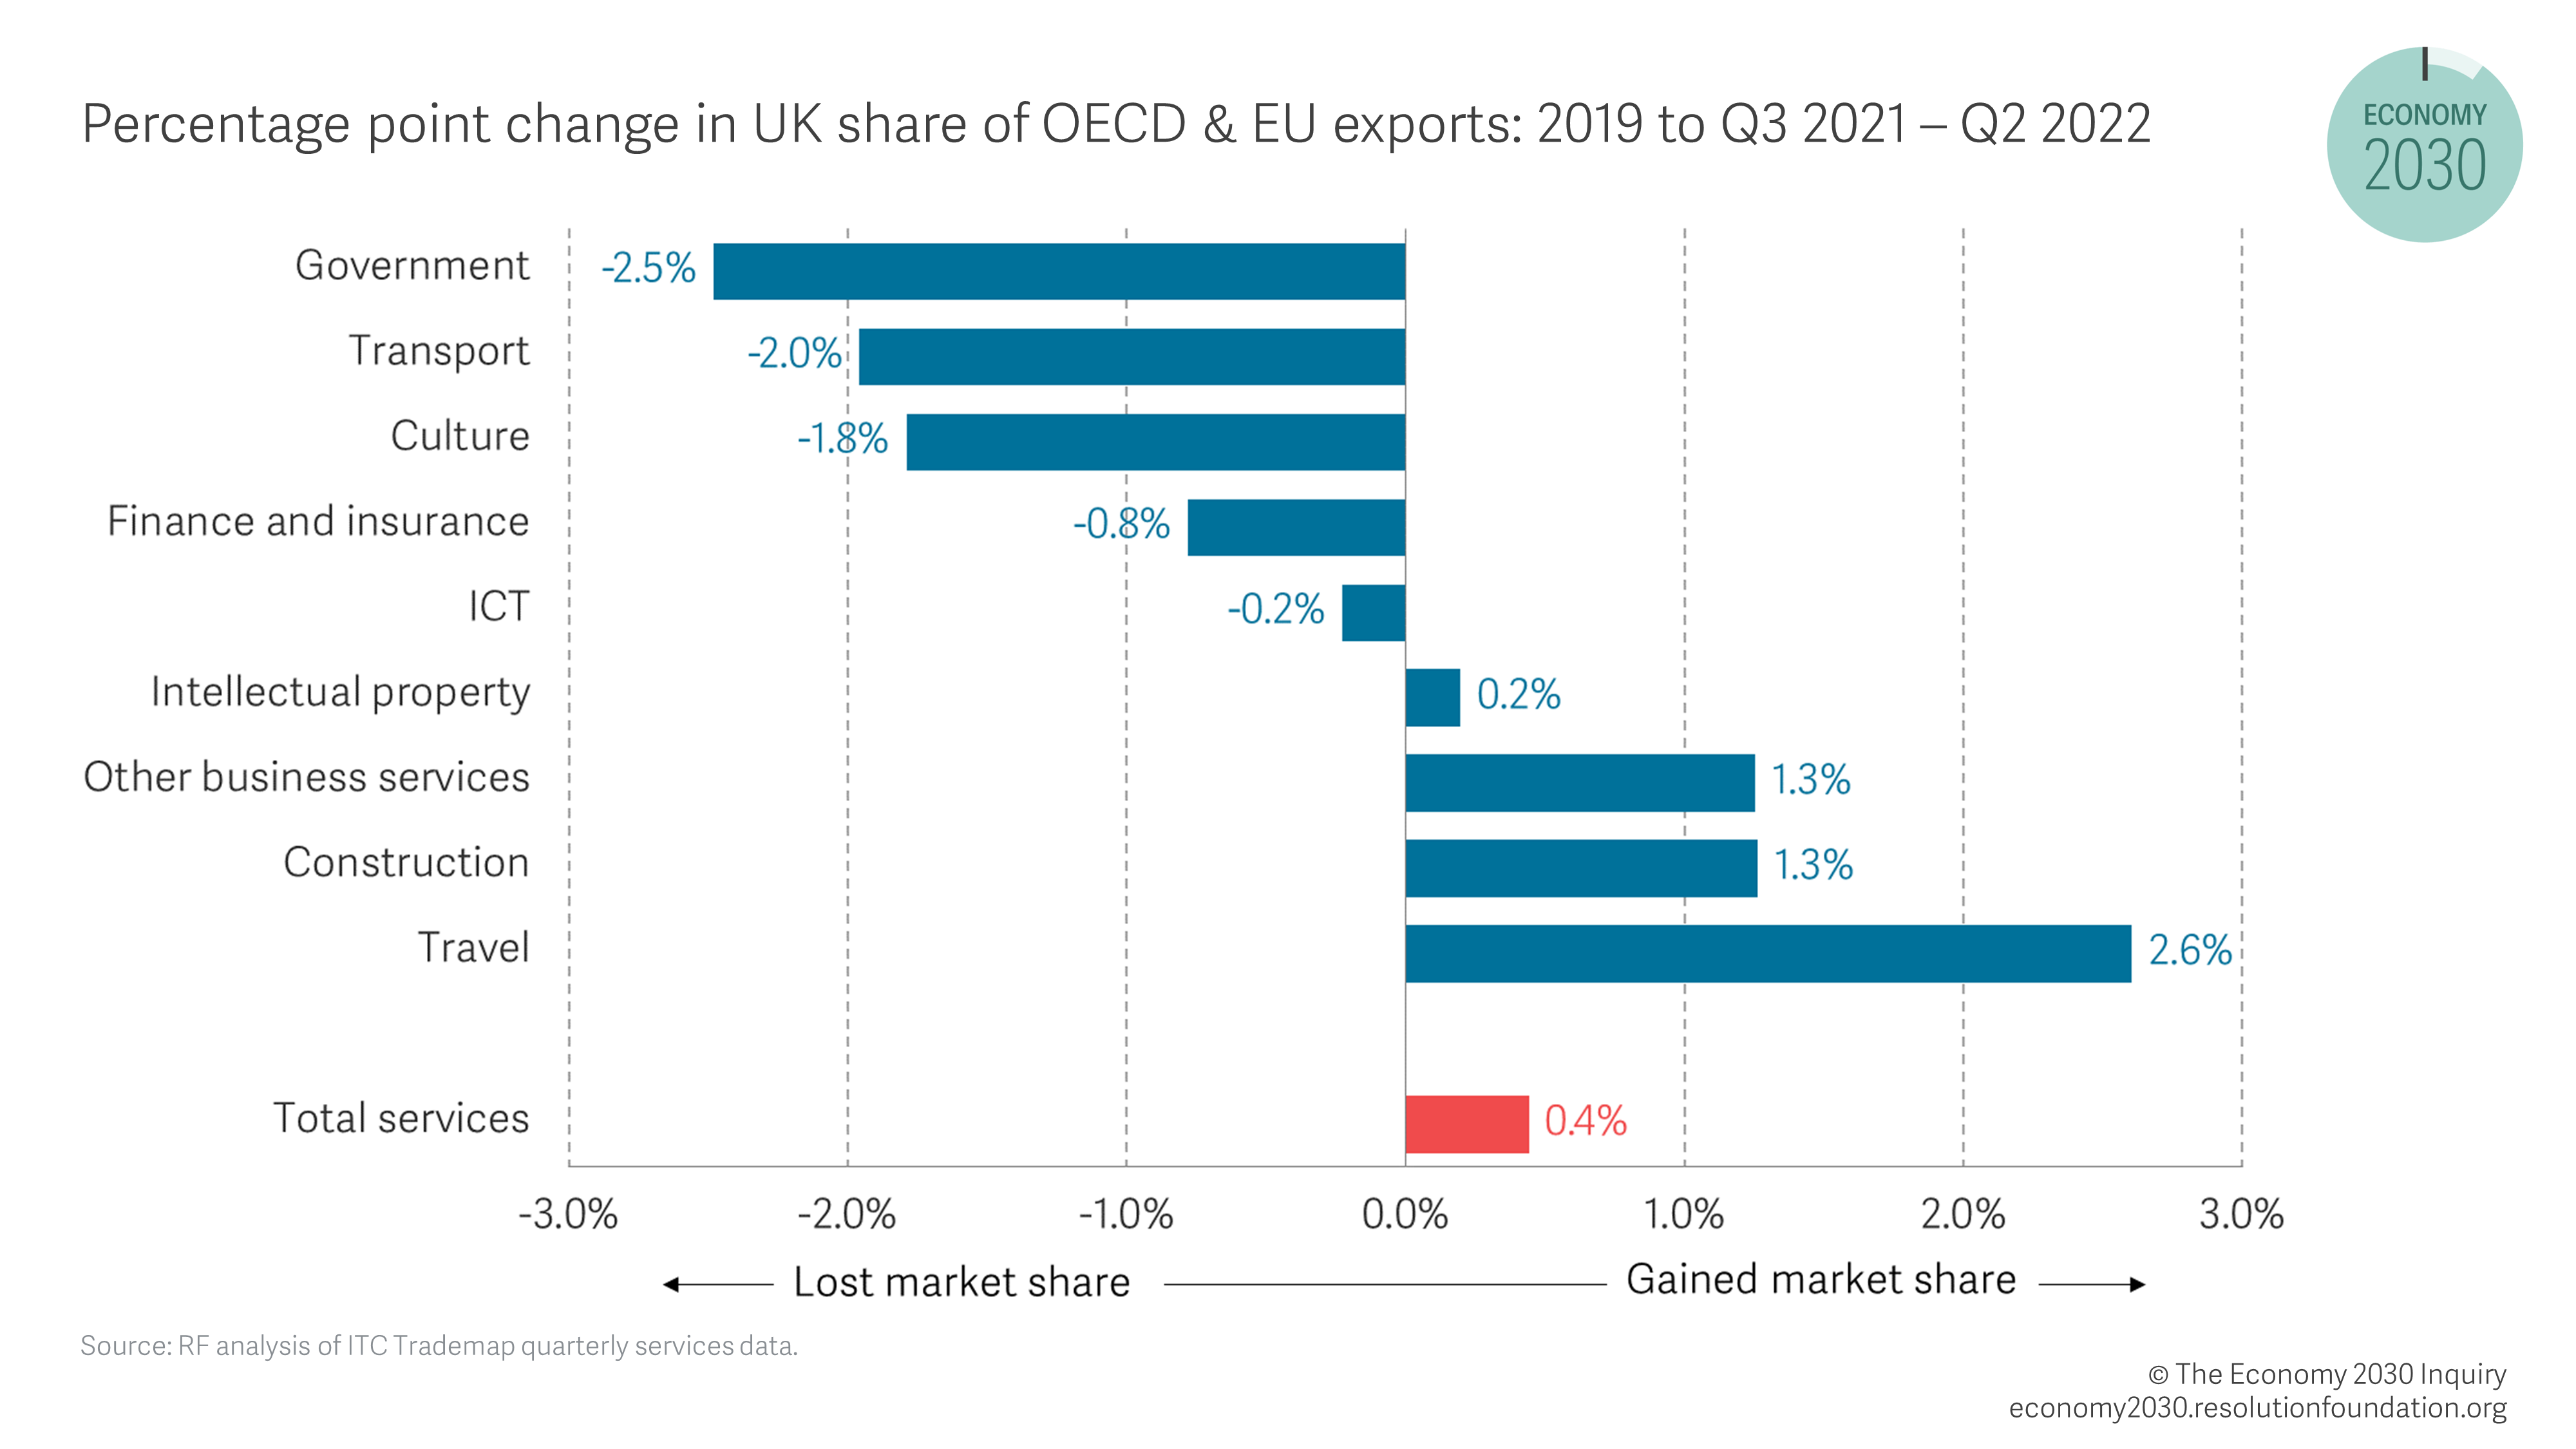
The largest increase in UK market share was in travel exports which grew by 2.6 percentage points. Travel was hit particularly hard by the Covid-19 pandemic in 2020 leading to sharp falls in exports across the world. But education exports (a sub-component of travel exports) which accounts for almost 40 per cent of UK travel exports, compared to 24 per cent for the US and just 3 per cent for the EU-27 in 2019 were relatively resilient. Therefore, the UK performed relatively well in travel compared with other OECD countries. While UK travel excluding education, exports fell by 75 per cent between 2019 and 2021, education exports fell by just 33 per cent.[ii]
The other notable sector where UK has gained market share is other business services, a large sector, accounting for more than a third of UK services exports in 2019, covering advertising, consultancy, engineering and legal services exports among others. UK business services exports grew by 26 per cent between Q1-Q3 2019 and Q1-Q3 2022. More than a quarter of this is accounted for by growth in services between affiliated enterprises, which grew 45 per cent with the EU (and 27 per cent with the rest of the world) – the uptick in the EU share of this activity could be linked to exporters reacting to new trade barriers by setting up subsidiaries in the EU. But the UK also experienced strong global export growth across several subsectors, including R&D (57 per cent), legal (59 per cent) and advertising, market research and public opinion polling (36 per cent). While some business services exports fell, for example architectural, engineering, scientific and other technical services (27 per cent), overall there was a relatively broad-based growth.
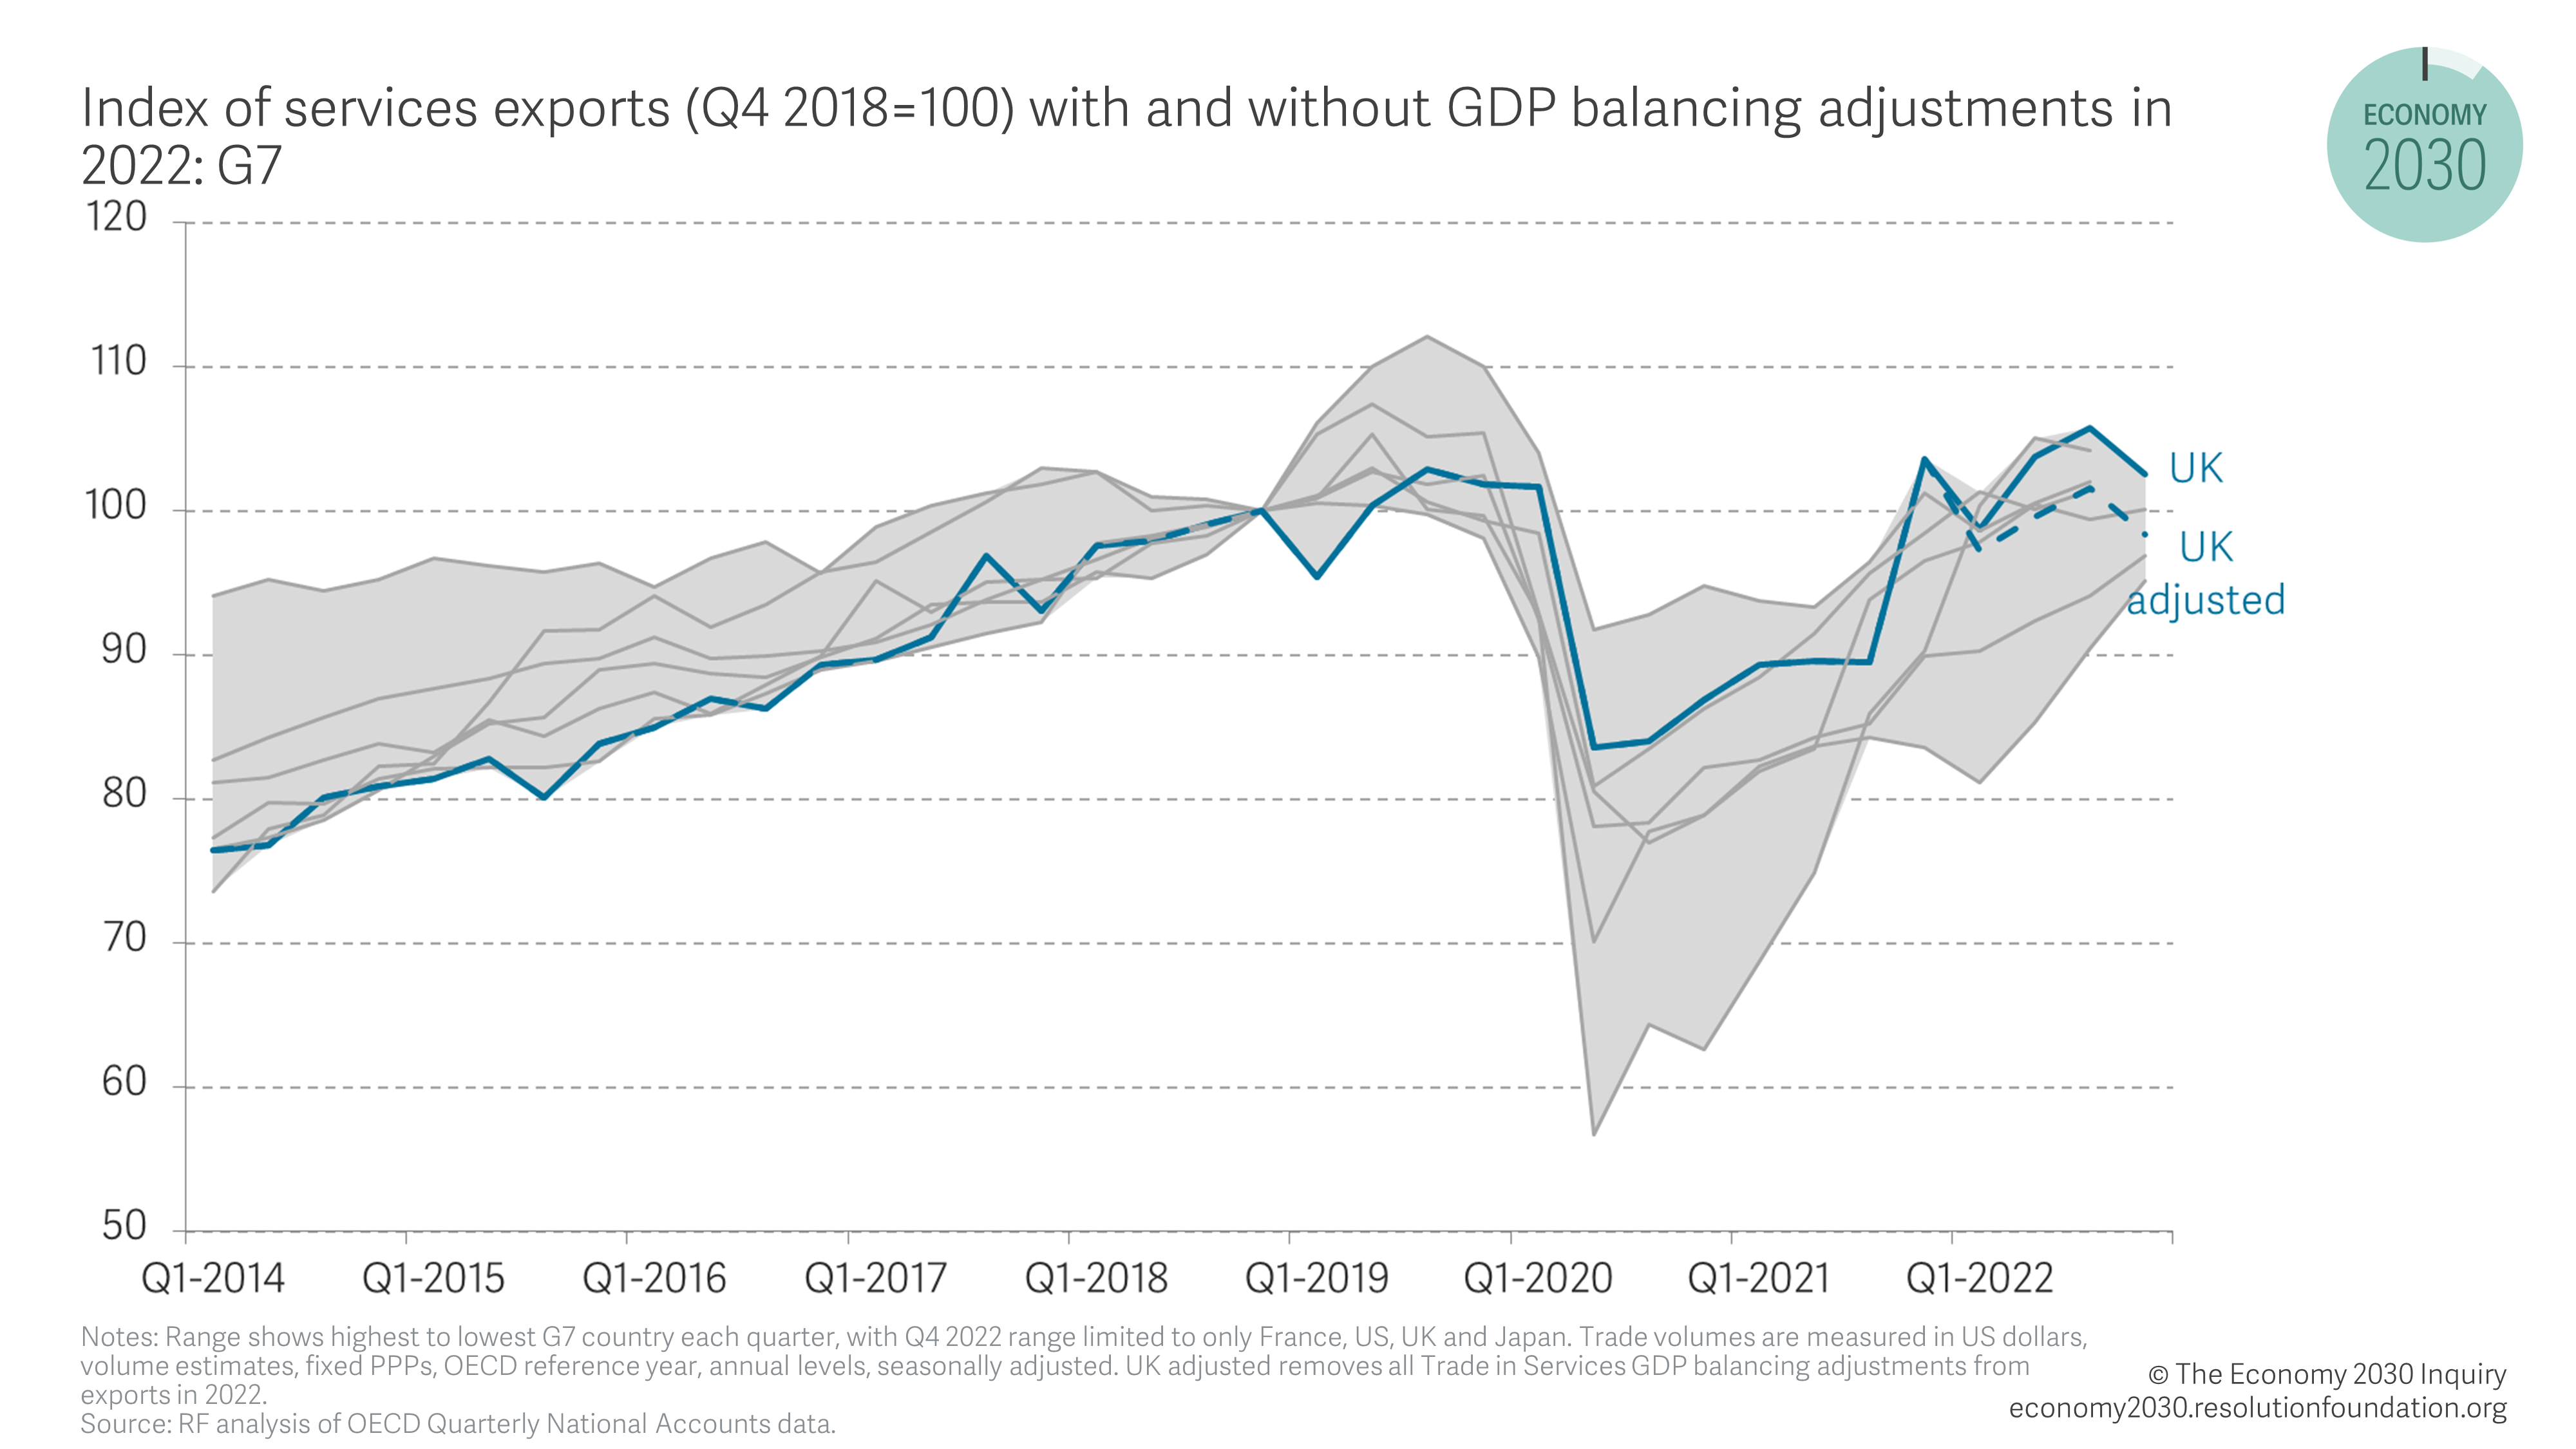
The market share gains suggest the UK has managed to not only benefit from global demand tailwinds, but also appears to have overperformed in certain sectors despite new trade restrictions with the EU. However, one final factor that is impacting services trade for the UK are the GDP ‘balancing’ adjustments made to trade in services data. These adjustments are made to help the ONS reconcile top-down and bottom-up measures of GDP given measurement problems. In recent quarters these adjustments have far exceeded those made in previous years, totalling £11.7 billion in 2022, compared to a maximum net annual adjustment of just £1.3 billion between 2018 and 2021. Removing these adjustments, as shown in Figure 6, leaves the UK underperforming France in terms of export volumes at the end of 2022 (as well Canada and Italy up to Q3 which is the latest data available). However, even with these adjustments fully removed, the UK’s services export performance still appears relatively resilient, and services exports are the one flow where the UK is not the weakest in the G7.
Figure 6: UK services exports look less exceptional when larger than normal GDP balancing adjustments in 2022 are removed
Improved UK trade openness should not be taken as an indication that UK competitiveness has improved despite Brexit
As we have shown above, we must be cautious when interpreting the trade data: the recent improvement in the UK’s relative openness, driven by stronger exports, cannot simply be interpreted as an improvement in the UK’s competitiveness. The boost to goods exports will likely be short-lived and underlying goods export competitiveness remains weak. On the other hand, the growth of demand in services that the UK specialises in appears resilient,
and UK firms may continue to benefit. What is more the UK has outperformed the typical OECD country, gaining market share in several sectors. However, growth in trade with affiliated enterprises and large adjustments made to the data for balancing purposes could be playing a key role here, with UK export volumes looking far less exceptional when these adjustments are removed. Given the importance of the debate and the scale of the potential impacts, it is vital we take the time to carefully understand what the data is telling us about how the UK is adapting to this change, in particular the important but often overlooked, due to data limitations, services trade data.
[i] Despite a rise in demand, the price of gold has been relatively stable since 2021
[ii] Estimate is calculated using a log-linear regression of OECD plus remaining EU countries exports to the world by UK dummy interacted with a post-TCA dummy (Q1 2021 to Q2 2022), weighted by country-sector size in 2019, and including exporter-quarter and sector-exporter fixed effects. Estimation details available on request.
[iii] Travel excluding education fell further than education across countries with comparable data, including in the US, New Zealand and Japan.